Temperature
Location
This report describes the typical weather at the Greenwood Airport (Greenwood, Nova Scotia, Canada) weather station over the course of an average year. It is based on the historical records from 1977 to 2012. Earlier records are either unavailable or unreliable.
Greenwood, Nova Scotia has a humid continental climate with warm summers and no dry season. The area within 25 miles of this station is covered byforests (65%), oceans and seas (32%), and lakes and rivers (2%).
Over the course of a year, the temperature typically varies from 13°F to 78°F and is rarely below -1°F or above 85°F.
Daily High and Low Temperature

The daily average low (blue) and high (red) temperature with percentile bands (inner band from 25th to 75th percentile, outer band from 10th to 90th percentile).
The warm season lasts from June 6 to September 14 with an average daily high temperature above 68°F. The hottest day of the year is July 26, with an average high of 78°F and low of 59°F.
The cold season lasts from December 5 to March 17 with an average daily high temperature below 39°F. The coldest day of the year is February 4, with an average low of 13°F and high of 29°F.
Fraction of Time Spent in Various Temperature Bands

The average fraction of time spent in various temperature bands: frigid (below 15°F), freezing (15°Fto 32°F), cold (32°F to 50°F), cool (50°F to 65°F), comfortable (65°F to 75°F), warm (75°F to 85°F), hot (85°F to 100°F) and sweltering (above 100°F).
Clouds
The median cloud cover ranges from 83% (mostly cloudy) to 98% (overcast). The sky is cloudiest onDecember 26 and clearest on September 15. The clearer part of the year begins around June 20. The cloudier part of the year begins around October 25.
Median Cloud Cover

The median daily cloud cover (black line) with percentile bands (inner band from 40th to 60th percentile, outer band from 25th to 75th percentile).
On September 15, the clearest day of the year, the sky is clear, mostly clear, or partly cloudy 42% of the time, and overcast or mostly cloudy 58% of the time.
On December 26, the cloudiest day of the year, the sky is overcast, mostly cloudy, or partly cloudy 87% of the time, and clear or mostly clear 11% of the time.
Cloud Cover Types

The fraction of time spent in each of the five sky cover categories. From top (most blue) to bottom (most gray), the categories are clear, mostly clear, partly cloudy, mostly cloudy, and overcast. Pink indicates missing data. Outside of the United States clear skies are often reported ambiguously, leading them to be lumped in with the missing data.
Precipitation
The probability that precipitation will be observed at this location varies throughout the year. Precipitation is most likely around January 6, occurring in 82% of days. Precipitation is least likely around August 26, occurring in 47% of days.
Probability of Precipitation at Some Point in the Day

The fraction of days in which various types of precipitation are observed. If more than one type of precipitation is reported in a given day, the more severe precipitation is counted. For example, if light rain is observed in the same day as a thunderstorm, that day counts towards the thunderstorm totals. The order of severity is from the top down in this graph, with the most severe at the bottom.
Over the entire year, the most common forms of precipitation are light rain, light snow, and moderate rain.
Light rain is the most severe precipitation observed during 29% of those days with precipitation. It is most likely around May 17, when it is observed during 29% of all days.
Light snow is the most severe precipitation observed during 25% of those days with precipitation. It is most likely around January 17, when it is observed during 44% of all days.
Moderate rain is the most severe precipitation observed during 18% of those days with precipitation. It is most likely around October 10, when it is observed during 18% of all days.
Types of Precipitation Throughout the Year

Relative frequency of various types of precipitation over the course of a typical year.
During the warm season, which lasts from June 6 to September 14, there is a 51% average chance that precipitation will be observed at some point during a given day. When precipitation does occur it is most often in the form of light rain (46% of days with precipitation have at worst light rain), moderate rain (27%), thunderstorms (14%), and drizzle (8%).
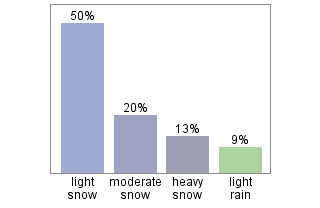
During the cold season, which lasts from December 5 to March 17, there is a 77% average chance that precipitation will be observed at some point during a given day. When precipitation does occur it is most often in the form of light snow (50% of days with precipitation have at worst light snow), moderate snow (20%), heavy snow (13%), and light rain (9%).

Snow
The likelihood of snow falling is highest around January 17, occurring in 71% of days. The season in which it is relatively likely for snow to fall spans from November 9 to April 15.
Probability of Snow Fall Being Reported in a Given Day

Probability that snow will be reported at least once in a given day. The season is defined as the period during which the probability is greater than one third the maximum probability.
During peak snow season, accumulation at this location on a given day is just more likely than not. The chances of there being snow on the ground are highest around February 11, occurring 55% of the time. The season in which snow is relatively likely to be on the ground spans from November 28 to April 5.
Chance of at Least Some Snow on the Ground

The probability that there is snow on the ground. The season is defined as the period during which the probability is greater than one third of the maximum probability.
The snow is typically at its deepest on January 31, with a median depth of 7.5"; the depth exceeds 18.8"only one year out of ten.
Snow Depth When there is Snow on the Ground

The median depth of snow during times when there is at least some snow on the ground, with percentile bands (inner band from 25th to 75th percentile, outer band from 10th to 90th percentile).
Humidity
The relative humidity typically ranges from 48% (comfortable) to 96% (very humid) over the course of the year, rarely dropping below 25% (dry) and reaching as high as 100% (very humid).
The air is driest around May 6, at which time the relative humidity drops below 61% (mildly humid) three days out of four; it is most humid around August 13, exceeding 94% (very humid) three days out of four.
Relative Humidity

The average daily high (blue) and low (brown) relative humidity with percentile bands (inner bands from 25th to 75th percentile, outer bands from 10th to 90th percentile).
Dew Point
Dew point is often a better measure of how comfortable a person will find the weather than relative humidity because it more directly relates to whether perspiration will evaporate from the skin, thereby cooling the body. Lower dew points feel drier and higher dew points feel more humid.
Over the course of a year, the dew point typically varies from 7°F (dry) to 64°F (mildy humid) and is rarely below -8°F (dry) or above 70°F (muggy).
The time of the year between May 24 and October 8 is the most comfortable, with dew points that are neither too dry nor too muggy.
Dew Point

The daily average low (blue) and high (red) dew point with percentile bands (inner band from 25th to 75th percentile, outer band from 10th to 90th percentile).
Wind
Over the course of the year typical wind speeds vary from 0 mph to 19 mph (calm to fresh breeze), rarely exceeding 31 mph (strong breeze).
The highest average wind speed of 11 mph (gentle breeze) occurs around January 17, at which time the average daily maximum wind speed is 19 mph (fresh breeze).
The lowest average wind speed of 7 mph (light breeze) occurs around August 10, at which time the average daily maximum wind speed is 14 mph (moderate breeze).
Wind Speed

The average daily minimum (red), maximum (green), and average (black) wind speed with percentile bands (inner band from 25th to 75th percentile, outer band from 10th to 90th percentile).
Wind Directions Over the Entire Year

The fraction of time spent with the wind blowing from the various directions over the entire year. Values do not sum to 100% because the wind direction is undefined when the wind speed is zero.
Fraction of Time Spent with Various Wind Directions

The fraction of time spent with the wind blowing from the various directions on a daily basis. Stacked values do not always sum to 100% because the wind direction is undefined when the wind speed is zero.